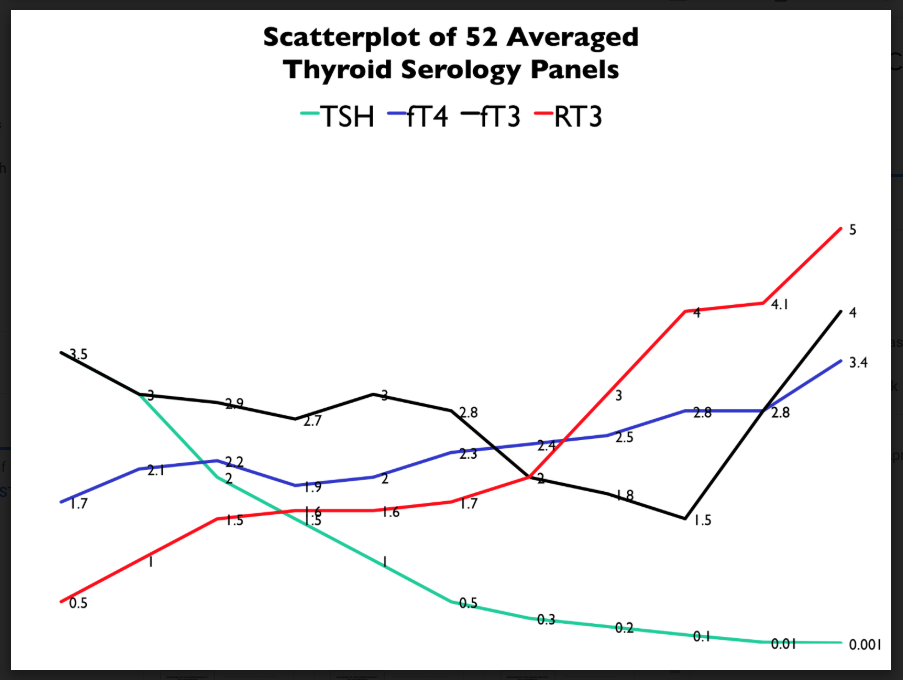
I generated this handy scatterplot from 52 different thyroid tests. These show how the TSH, the free T3, the free T4, and the reverse T3 tend to move together. What does it all mean, though?
What happens here is that the pituitary tells your body to produce more or less thyroid hormone (in fact, that your body needs it). Specifically, though, it is telling the thyroid whether or not it should get bigger or smaller.
When there is too much hormone, the pituitary lowers the TSH. This is what you can see on the right hand of this slide, in the form of the blue line making a downward trajectory.
When there is too little hormone, the pituitary demands more TSH. This is the opposite side where you can see that same blue line making a steady upward climb.
On the left side, where the black line (your T3) and the green line (your TSH) intersect, the T3 levels make a brief dip before raising up again (as your TSH drops). I really want to focus on what is happening right there, at that moment.
Basically, your brain is telling your thyroid how much hormone it wants. But, the rest of your body is trying to make due with the wrong amount of thyroid hormone currently in your system. So, as it dips, you may stop seeing these two correspond with one another.
At about 0.1 on this graph, both the T3 and the TSH has dropped. Your brain is basically telling your thyroid to slow down, all while your liver and your kidneys are bailing out this extra thyroid hormone that they think is the new normal.


